Welcome to Stories with Data, Week 2
Today we will examine the problem of Rising Credit Card Defaults and Personal Loan Portfolio Management in Scheduled Commercial Banks
The Banker’s Dilemma
A story of credit, risk, and the numbers that keep bankers awake at night
Rajesh stared at the quarterly report, his coffee growing cold. As Chief Credit Officer at a major public sector bank, the numbers told a troubling story. The morning sun filtered through his office window, but the atmosphere inside was anything but bright.
“Credit cards are our biggest problem,” he muttered to himself.
The growth numbers seemed impressive at first glance—credit card outstanding balances had grown 27.5% this year. But Rajesh knew better than to celebrate. Last year, the growth had been 30.6%. The slowdown was evident across the board.
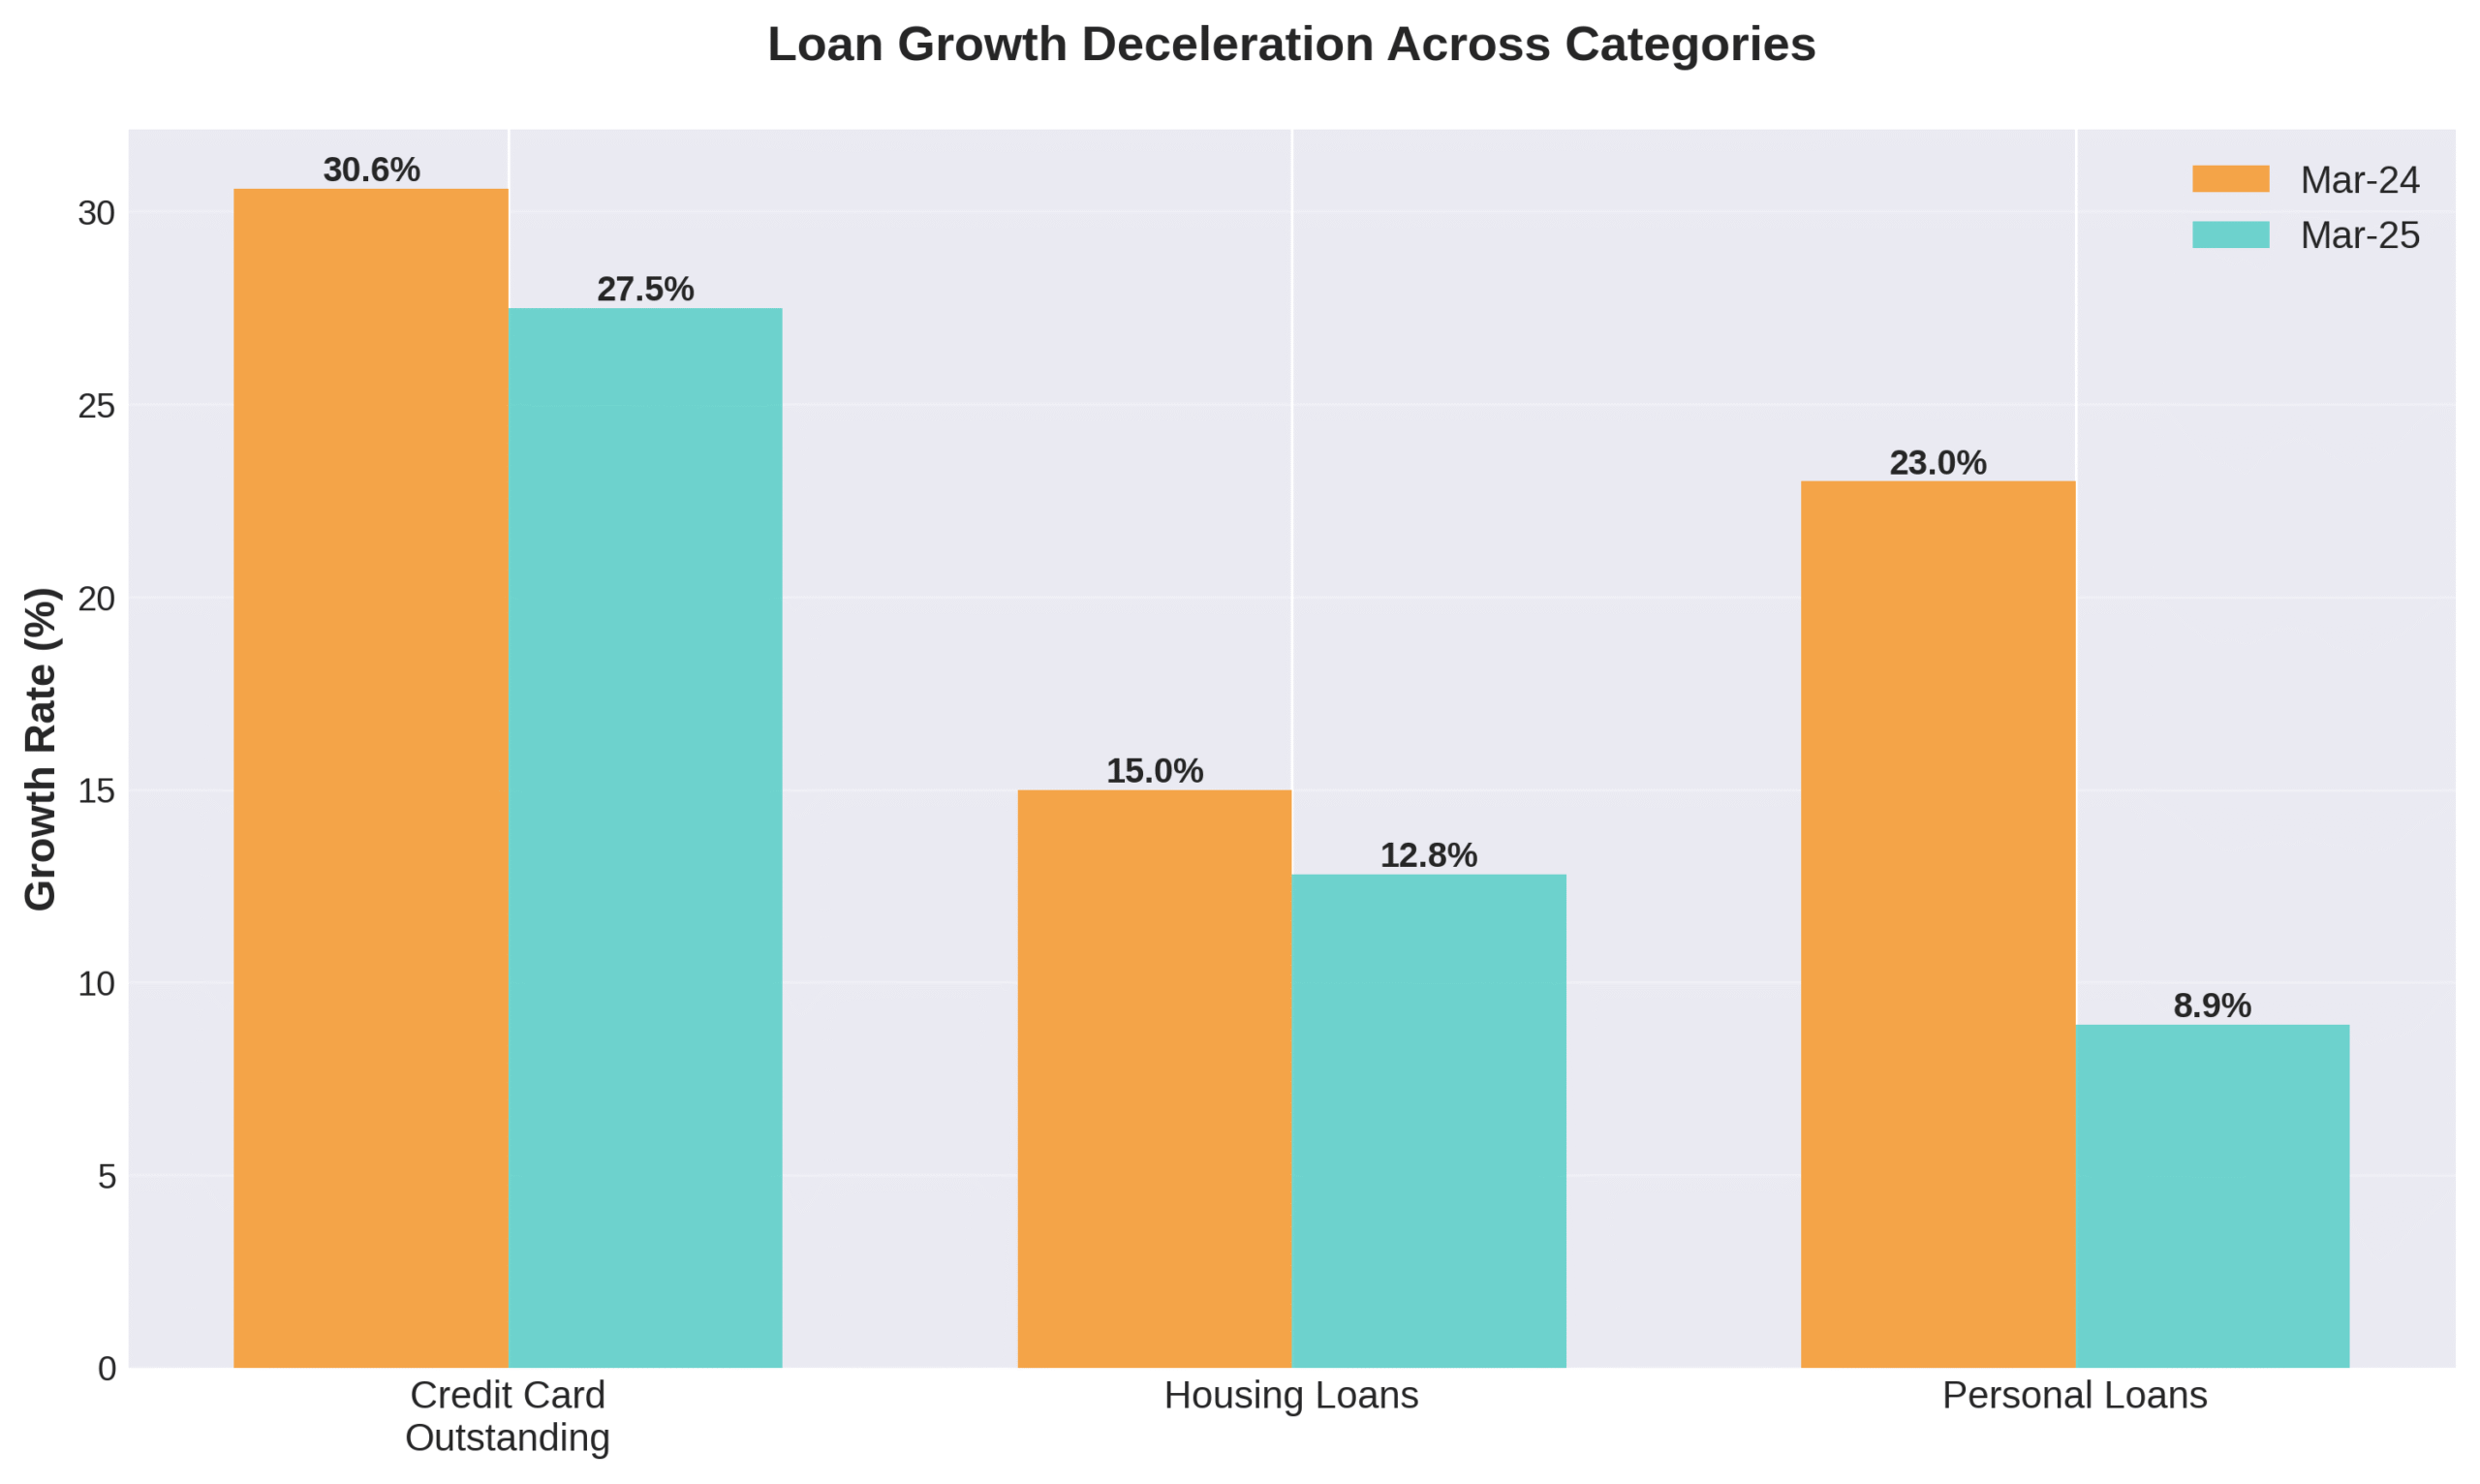
Figure 1: The deceleration was clear—every loan category was losing momentum (Source: RBI Financial Stability Report, Chart 2.1)
His colleague Priya walked in, holding her own copy of the report. “What’s the damage?” she asked, knowing the answer wouldn’t be good.
“It’s worse than I thought,” Rajesh replied, pulling up another chart on his screen. “Look at this.”
The asset quality numbers painted a stark picture. Credit card receivables had the highest gross non-performing assets at 14.3%—meaning nearly one in seven credit card loans was turning bad. In contrast, housing loans maintained a remarkably low GNPA of just 1.0%.
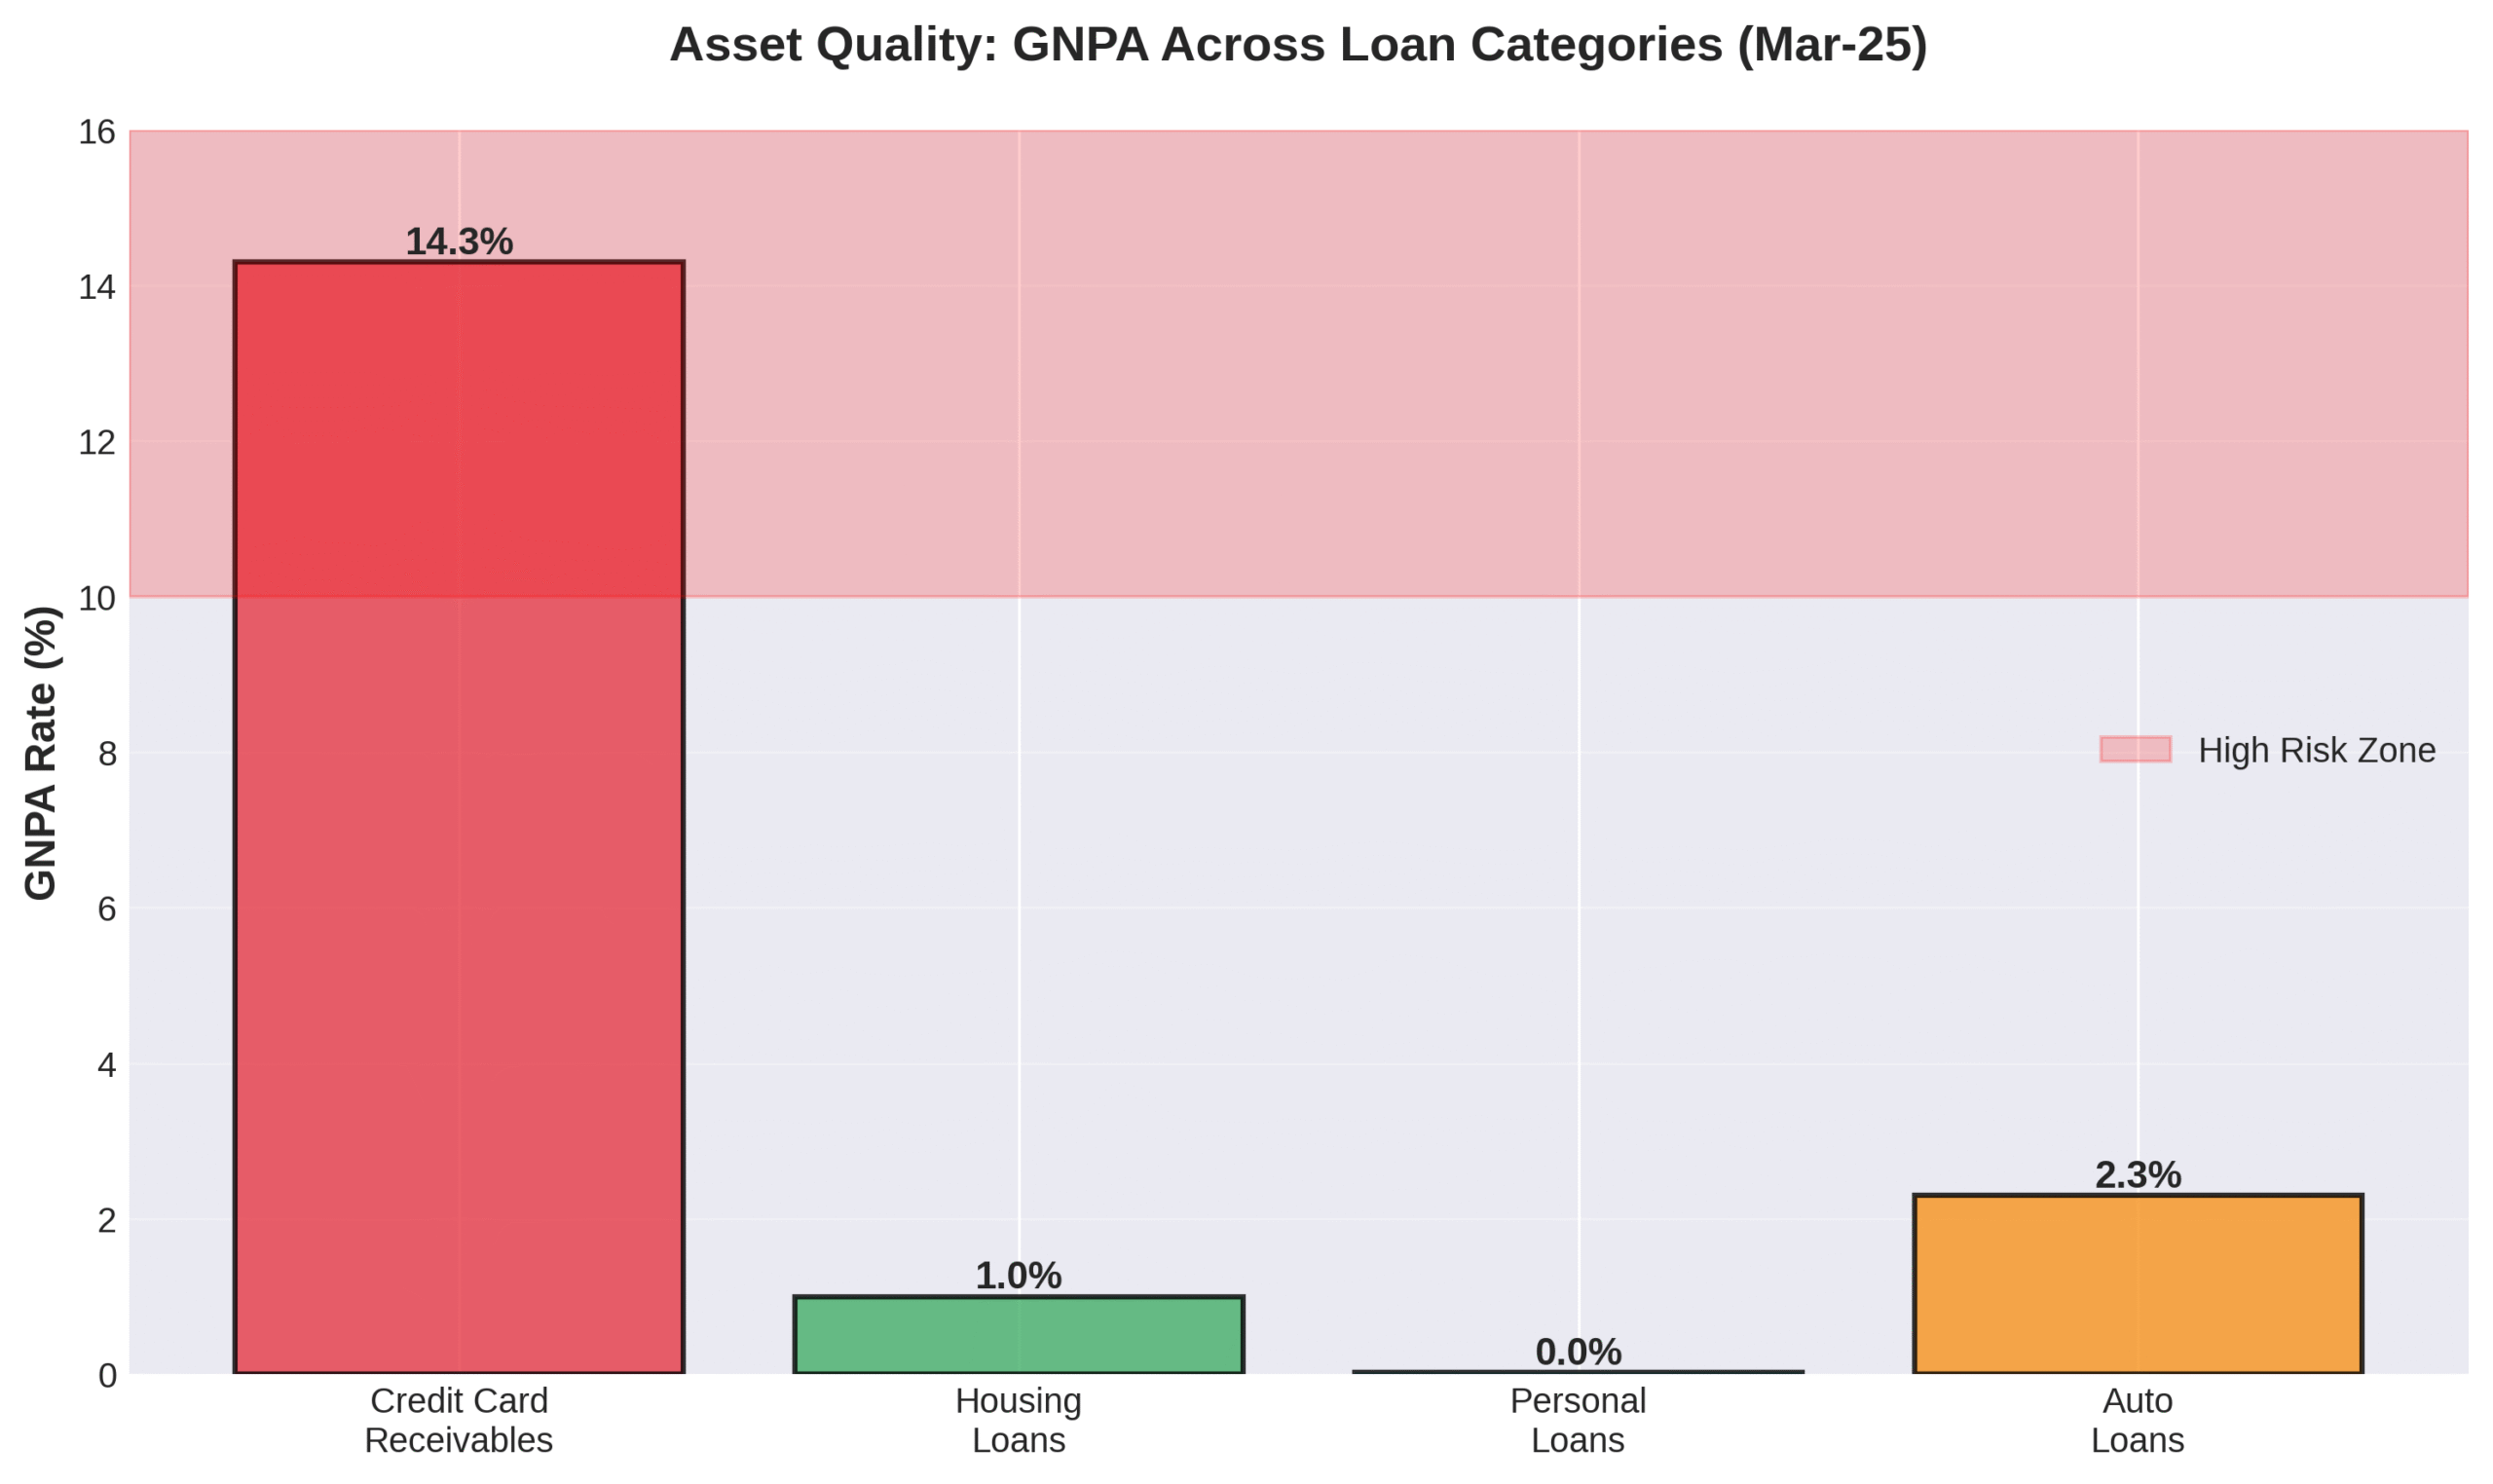
Figure 2: Credit cards deep in the danger zone while housing loans remained rock solid (Source: RBI Financial Stability Report, Chart 2.1b)
Priya leaned in closer. “That’s alarming. What’s driving this?”
“Market saturation,” Rajesh explained, clicking to the next slide. “We’re seeing it everywhere. Active credit card consumers grew only 3.7% this year, compared to 9.9% last year. People aren’t just slowing down—they’re maxing out and defaulting more.”
Warning Sign: When consumer acquisition drops by nearly two-thirds in a single year, it signals deeper market problems.
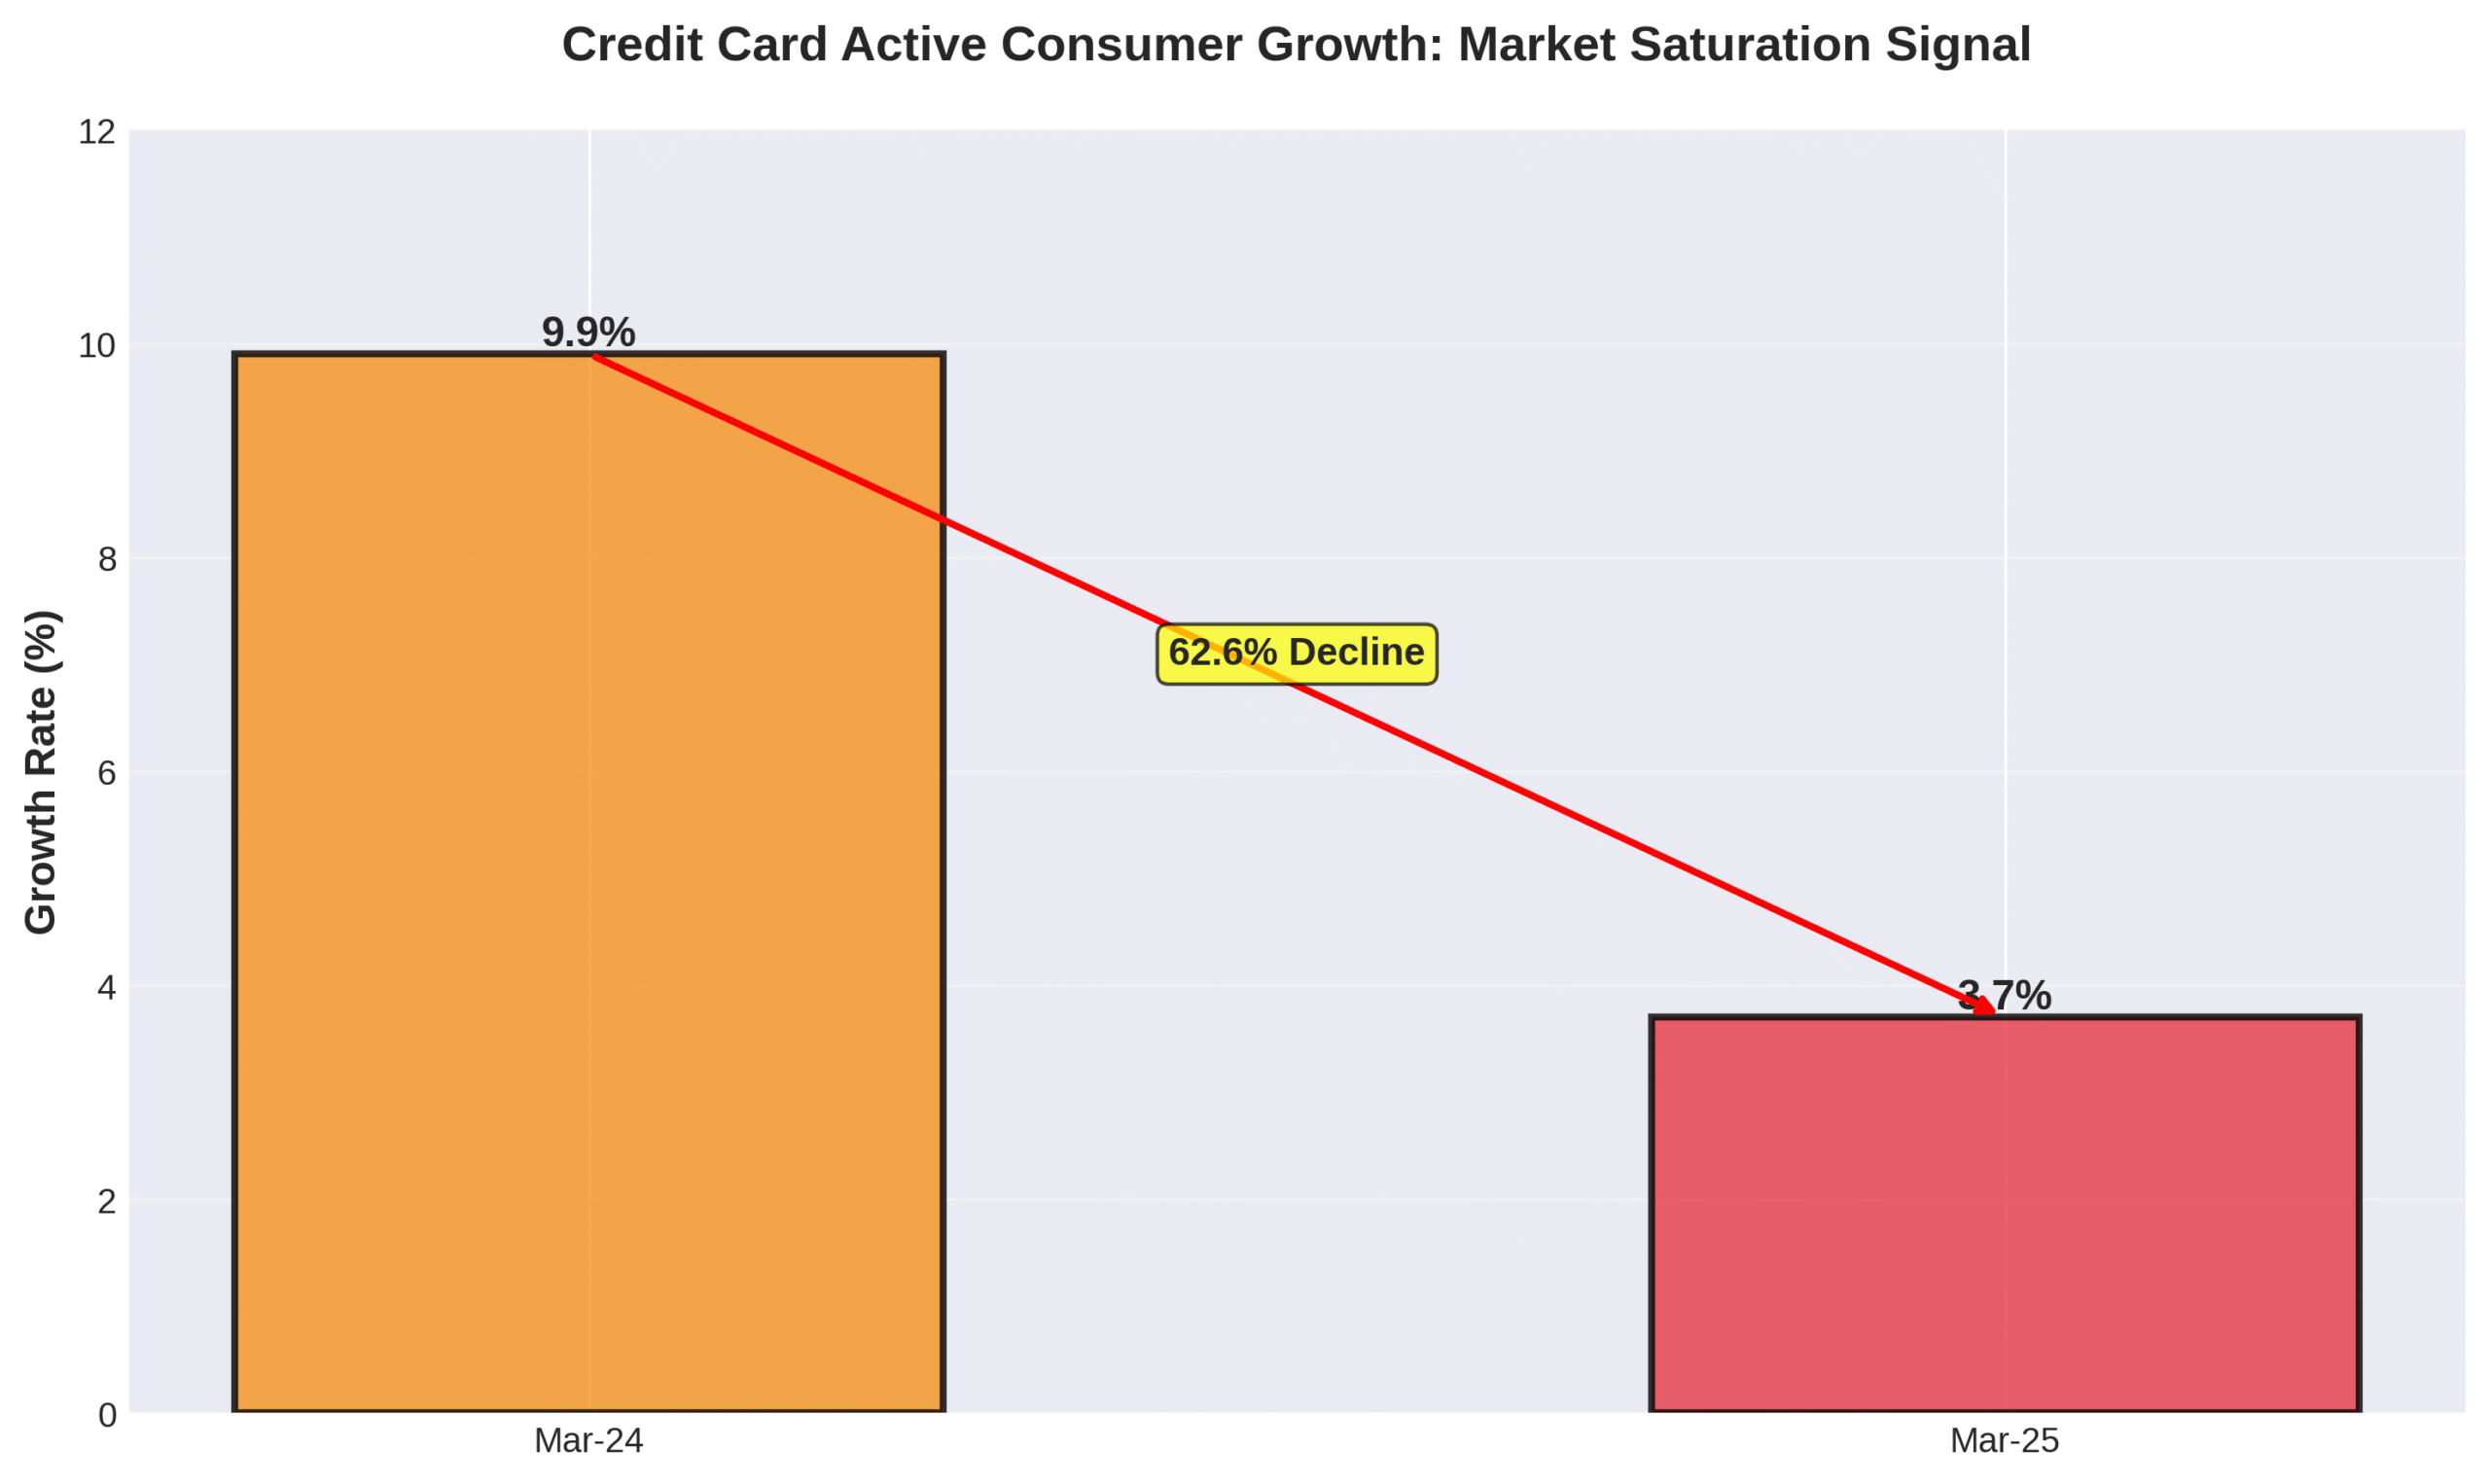
Figure 3: The market saturation signal—a 62.6% decline in consumer growth (Source: RBI Financial Stability Report, Chart 2.1d)
Priya studied the numbers carefully. “What about personal loans? I heard they were doing well.”
“Were,” Rajesh emphasized. “Personal loan growth dropped sharply from 23.0% to just 8.9% year-over-year. The correction we feared is here.”
He stood up and walked to the window, looking out at the city below. Somewhere out there, thousands of borrowers were struggling with debt they couldn’t repay. The human cost behind these numbers weighed heavily on him.
“So what’s keeping us afloat?” Priya asked.
Rajesh turned back with a slight smile. “Housing loans. They’re the bedrock of our portfolio.”
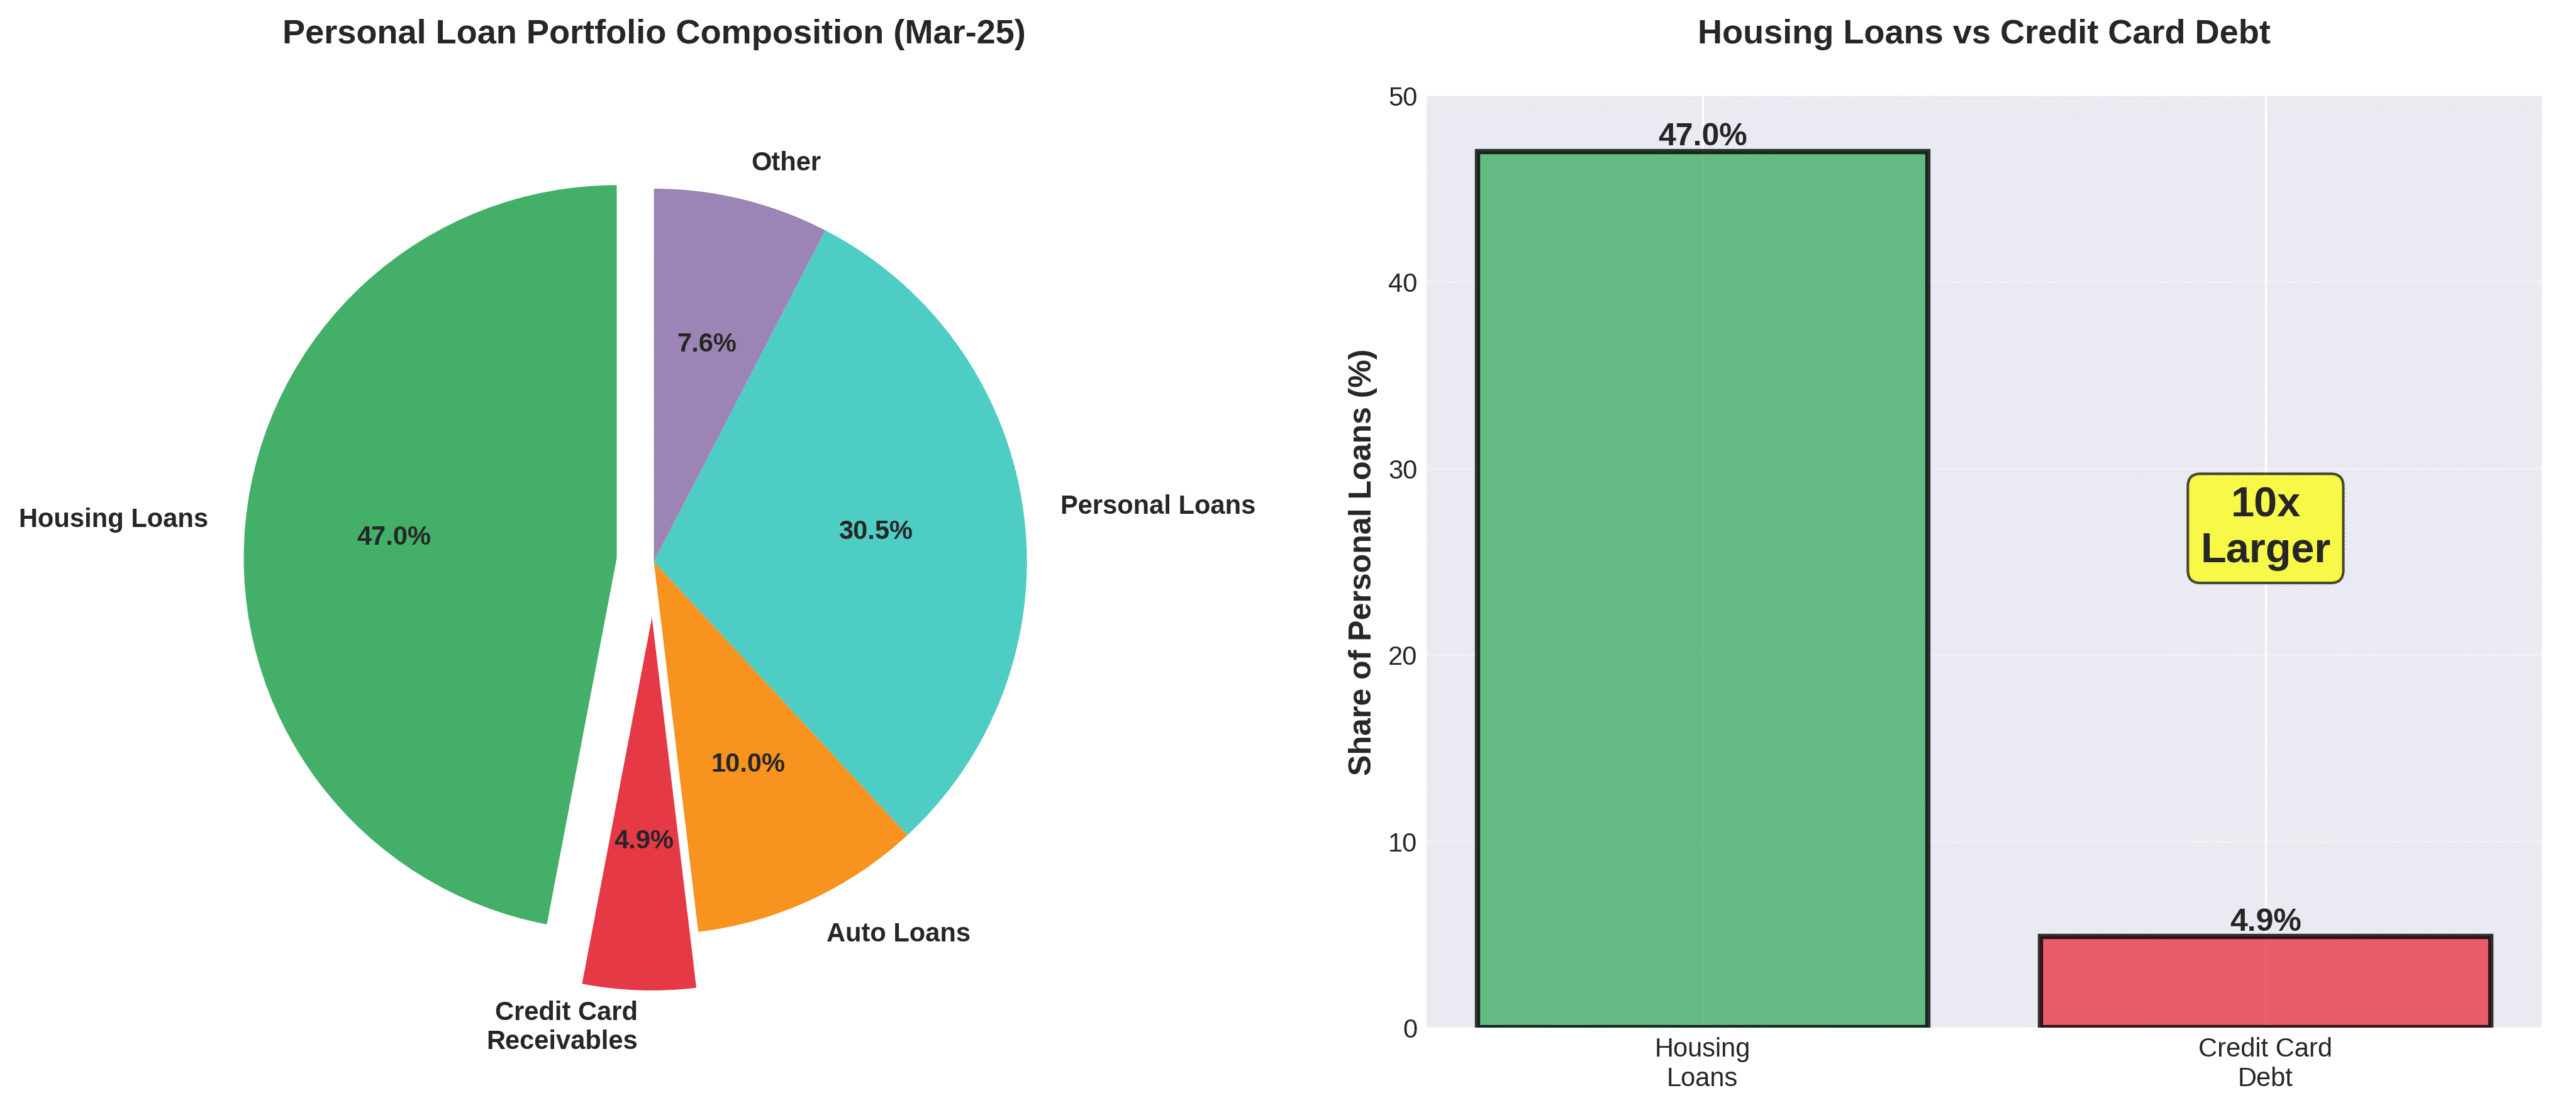
Figure 4: The portfolio reality—housing loans dominate while credit cards remain a small but risky segment (Source: RBI Financial Stability Report, Chart 2.1c)
He pulled up the final chart. “Look at this. Housing loans represent 47% of our personal loan portfolio with steady 12.8% growth and barely 1% GNPA. Credit card debt? Just 4.9% of the portfolio.”
10x
Housing loans are ten times larger than credit card debt
“So why are we so worried about credit cards?” Priya asked.
“Because they’re the canary in the coal mine,” Rajesh explained. “When credit card defaults spike, it means consumers are in trouble. They pay their mortgages first—they’ll skip credit card payments before losing their homes. But if credit card defaults are this high, what happens when the economy really turns?”
The room fell silent as the implication sank in.
“So what’s our strategy?” Priya finally asked.
Rajesh returned to his desk, his decision made. “Back to basics. We focus on secured lending—mortgages, loans against property. We tighten credit card standards significantly. And we monitor personal loans like hawks.”
He closed his laptop with finality. “The credit card party is over. It’s time to remember what banking is really about—prudent lending to people who can actually pay us back.”
The Bottom Line: When unsecured lending shows stress, smart banks pivot back to secured assets. Housing remains stable because people prioritize keeping a roof over their heads.
Epilogue: Three Months Later
Rajesh’s team had successfully restructured their lending priorities. Credit card approvals were down 40%, but defaults had stabilized. Meanwhile, their housing loan portfolio grew steadily, providing the stable returns the bank needed.
The quarterly board meeting ended with rare applause. As Rajesh walked out, Priya caught up with him.
“You know what you did, right?” she said. “You chose boring stability over exciting growth.”
Rajesh smiled. “In banking, boring is beautiful. When you’re responsible for people’s money, excitement usually means someone’s losing theirs.”
They walked down the corridor together, past the framed mission statement on the wall: “Banking built on trust, secured by prudence.”
For the first time in months, Rajesh felt those words meant something again.
References and Data Sources
1. Primary Source:
Reserve Bank of India (2025). Financial Stability Report, Issue 30, June 2025. Chart 2.1: Deposit and Credit Profile of SCBs. Retrieved from https://www.rbi.org.in
2. Additional Analysis:
All growth rates, GNPA ratios, and portfolio composition percentages are derived from RBI Financial Stability Report data, representing Public Sector Banks (PSBs), Private Banks (PVBs), and Foreign Banks (FBs) performance metrics for the period March 2024 to March 2025.
3. Analytical Framework:
The narrative analysis and interpretations are based on standard banking risk management principles and portfolio theory, drawing insights from publicly available regulatory data and academic research on credit risk assessment in scheduled commercial banks.
Important Disclosures
1. AI-Assisted Writing: This article was written with assistance from Claude AI. While I’ve made every effort to ensure accuracy, there may be errors. I sincerely apologize for any mistakes.
2. Fictional Characters: The Mehta family and Priya Sharma are fictional characters created solely to make complex financial data accessible and engaging. All economic data and trends are real and properly cited. If any content inadvertently causes offense, I sincerely a apologize—no harm was intended.
3. Intent and Purpose: This article is written purely to encourage critical thinking, independent research, and data-driven analysis among readers. It is not intended as a critique of any government policies, institutions, or individuals. The analysis is based on publicly available data and academic research, presented objectively to foster informed discussion. If any content is interpreted as criticism, I sincerely apologize—that was never my intention.